Electrify Chicago
According to the
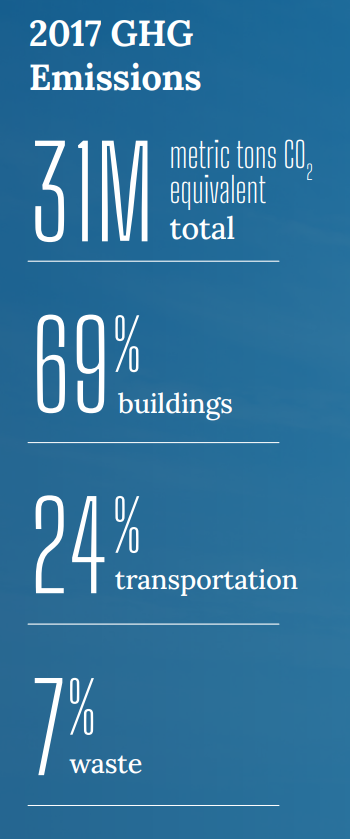
2022 Chicago Climate Action Plan ,
a whopping 69% of Chicago's emissions come from buildings, making it
our biggest challenge and our biggest opportunity as a city to tackle
change. At Electrify Chicago we want to showcase some of the best and worst performing
buildings in the city using publicly available data and manual annotations to add
building photographs and label multi-building owners like universities.
,
a whopping 69% of Chicago's emissions come from buildings, making it
our biggest challenge and our biggest opportunity as a city to tackle
change. At Electrify Chicago we want to showcase some of the best and worst performing
buildings in the city using publicly available data and manual annotations to add
building photographs and label multi-building owners like universities.
You can start by looking at Chicago's buildings with the highest greenhouse gas intensity - this means that they use the most energy when adjusted per unit of square foot, so big buildings could actually perform much better than very inefficient small buildings on this metric.
Chicago Buildings by Greenhouse Gas Intensity
Note: Data only includes large Chicago buildings from 2020
Note: This data only includes buildings whose emissions are reported
under the
Chicago Energy Benchmarking Ordinance. According to the City “As of 2016,
this list includes all commercial, institutional, and residential buildings larger than
50,000 square feet.” This dataset is also then filtered to only buildings with
reported emissions > 1,000 metric tons CO2 equivalent.
This data is also from 2020, but when new benchmark data is available, we'll update the site.
| Property Name / address | Primary Property Type |
Greenhouse Gas Intensity (kg CO2 eq./sqft) |
Total Greenhouse Emissions (metric tons CO2 eq.) |
|---|---|---|---|
|
Wentworth Rehab and Healthcare Center
201 W 69TH ST
| Senior Living Community | 14.7 kg/sqft
Highest 14%
| 1,322 tons
Lowest 20%
|
|
850 W Jackson Blvd
850 W Jackson Blvd
| Office | 14.6 kg/sqft
Highest 14%
| 1,546 tons
Lowest 32%
|
|
55 E Jackson Blvd
55 E Jackson Blvd
| Office | 14.5 kg/sqft
Highest 14%
| 6,293 tons
Highest 12%
|
|
700 N Michigan Ave LLC
700 N Michigan Ave
| Retail Store | 14.4 kg/sqft
Highest 14%
| 2,545 tons
Highest 37%
|
|
U.S. Bank -- Pullman Branch
1000 E 111th St
| Office | 14.3 kg/sqft
Highest 14%
| 1,372 tons
Lowest 23%
|
|
Friend Family Health Center at University of Chicago
800 E 55th St
| Medical Office | 14.3 kg/sqft
Highest 14%
| 1,050 tons
Lowest 4%
|
|
Illinois Center Lakeshore Athletic Club
211 N STETSON AVE
| Fitness Center/Health Club/Gym | 14.2 kg/sqft
Highest 15%
| 1,677 tons
Lowest 36%
|
|
The Peninsula Chicago
108 E Superior St
| Hotel | 14.2 kg/sqft
Highest 15%
| 5,835 tons
Highest 13%
|
|
Greek Islands (200 S Halsted)
200 210 S HALSTED ST
| Office | 14.1 kg/sqft
Highest 15%
| 1,627 tons
Lowest 34%
|
|
375 E Chicago Ave
🚩
375 E Chicago Ave
| College/University | 14.1 kg/sqft
Highest 15%
| 5,490 tons
Highest 14%
|
|
1 W WASHINGTON ST
1 W WASHINGTON ST
| Hotel | 14.0 kg/sqft
Highest 15%
| 1,187 tons
Lowest 14%
|
|
730 N Michigan Ave
730 N Michigan Ave
| Other - Mall | 14.0 kg/sqft
Highest 15%
| 3,190 tons
Highest 28%
|
|
1407 on Michigan
1411 S Michigan Avenue
| Mixed Use Property | 14.0 kg/sqft
Highest 15%
| 1,138 tons
Lowest 10%
|
|
2303 N CLYBOURN AVE
2303 N CLYBOURN AVE
| Multifamily Housing | 13.9 kg/sqft
Highest 15%
| 1,980 tons
Lowest 48%
|
|
Jetro Restaurant Depot
1030 W DIVISION ST
| Wholesale Club/Supercenter | 13.9 kg/sqft
Highest 15%
| 2,104 tons
Highest 48%
|
Data Source:
Chicago Energy Benchmarking Data