Electrify Chicago
According to the
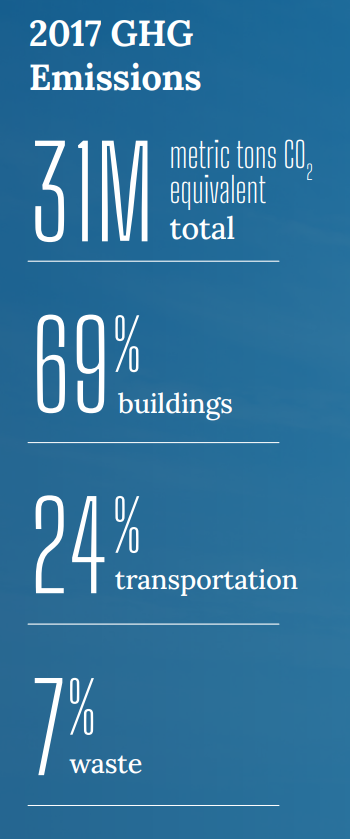
2022 Chicago Climate Action Plan ,
a whopping 69% of Chicago's emissions come from buildings, making it
our biggest challenge and our biggest opportunity as a city to tackle
change. At Electrify Chicago we want to showcase some of the best and worst performing
buildings in the city using publicly available data and manual annotations to add
building photographs and label multi-building owners like universities.
,
a whopping 69% of Chicago's emissions come from buildings, making it
our biggest challenge and our biggest opportunity as a city to tackle
change. At Electrify Chicago we want to showcase some of the best and worst performing
buildings in the city using publicly available data and manual annotations to add
building photographs and label multi-building owners like universities.
You can start by looking at Chicago's buildings with the highest greenhouse gas intensity - this means that they use the most energy when adjusted per unit of square foot, so big buildings could actually perform much better than very inefficient small buildings on this metric.
Chicago Buildings by Greenhouse Gas Intensity
Note: Data only includes large Chicago buildings from 2020
Note: This data only includes buildings whose emissions are reported
under the
Chicago Energy Benchmarking Ordinance. According to the City “As of 2016,
this list includes all commercial, institutional, and residential buildings larger than
50,000 square feet.” This dataset is also then filtered to only buildings with
reported emissions > 1,000 metric tons CO2 equivalent.
This data is also from 2020, but when new benchmark data is available, we'll update the site.
| Property Name / address | Primary Property Type |
Greenhouse Gas Intensity (kg CO2 eq./sqft) |
Total Greenhouse Emissions (metric tons CO2 eq.) |
|---|---|---|---|
|
Walmart Supercenter #5781
8331 S Stewart Ave
| Wholesale Club/Supercenter | 13.3 kg/sqft
Highest 16%
| 1,971 tons
Lowest 47%
|
|
Farragut Career Academy HS -CPS
2345 S Christiana Ave
| K-12 School | 13.3 kg/sqft
Highest 16%
| 4,781 tons
Highest 17%
|
|
Presence Center for Advanced Care
331 W Surf St
| Medical Office | 13.3 kg/sqft
Highest 16%
| 3,198 tons
Highest 28%
|
|
John T. Rettaliata Engineering Center
🏆
(Illinois Tech)
10 W 32nd Street
| College/University | 13.2 kg/sqft
Highest 17%
| 1,773 tons
Lowest 41%
|
|
CICS ChicagoQuest School and The Noble Academy
1409 - 1443 N Ogden Ave
| K-12 School | 13.2 kg/sqft
Highest 17%
| 1,201 tons
Lowest 15%
|
|
Axis Apartments & Lofts
441 E Erie St
| Multifamily Housing | 13.2 kg/sqft
Highest 17%
| 7,538 tons
Highest 9%
|
|
The Private Residences at Ontario Place Condominiu
10 E Ontario St
| Multifamily Housing | 13.2 kg/sqft
Highest 17%
| 6,478 tons
Highest 11%
|
|
Hyde Park Tower
5140 S Hyde Park Blvd
| Multifamily Housing | 13.2 kg/sqft
Highest 17%
| 1,893 tons
Lowest 45%
|
|
The Bridgeport Condominiums
3434 3464 S HALSTED ST
| Multifamily Housing | 13.1 kg/sqft
Highest 17%
| 1,284 tons
Lowest 19%
|
|
919 S California Ave
919 S California Ave
| Other | 13.0 kg/sqft
Highest 17%
| 1,103 tons
Lowest 8%
|
|
Julian HS -CPS
10330 S Elizabeth St
| K-12 School | 12.9 kg/sqft
Highest 17%
| 3,441 tons
Highest 26%
|
|
Millennium Park Plaza
151 - 155 N Michigan Ave
| Multifamily Housing | 12.9 kg/sqft
Highest 17%
| 7,876 tons
Highest 8%
|
|
The Clare
55 E Pearson St
| Multifamily Housing | 12.9 kg/sqft
Highest 17%
| 8,121 tons
Highest 8%
|
|
Bell Federal Building
79 W Monroe St
| Office | 12.8 kg/sqft
Highest 18%
| 2,551 tons
Highest 37%
|
|
Friedman Properties, Ltd
420 N Wabash Ave
| Office | 12.8 kg/sqft
Highest 18%
| 1,309 tons
Lowest 20%
|
Data Source:
Chicago Energy Benchmarking Data