Electrify Chicago
According to the
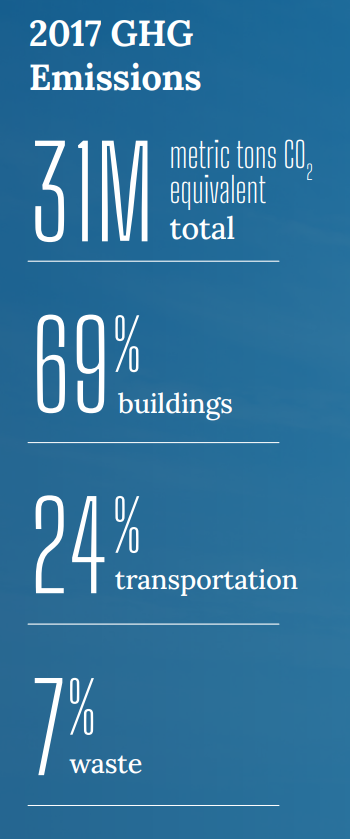
2022 Chicago Climate Action Plan ,
a whopping 69% of Chicago's emissions come from buildings, making it
our biggest challenge and our biggest opportunity as a city to tackle
change. At Electrify Chicago we want to showcase some of the best and worst performing
buildings in the city using publicly available data and manual annotations to add
building photographs and label multi-building owners like universities.
,
a whopping 69% of Chicago's emissions come from buildings, making it
our biggest challenge and our biggest opportunity as a city to tackle
change. At Electrify Chicago we want to showcase some of the best and worst performing
buildings in the city using publicly available data and manual annotations to add
building photographs and label multi-building owners like universities.
You can start by looking at Chicago's buildings with the highest greenhouse gas intensity - this means that they use the most energy when adjusted per unit of square foot, so big buildings could actually perform much better than very inefficient small buildings on this metric.
Chicago Buildings by Greenhouse Gas Intensity
Note: Data only includes large Chicago buildings from 2020
Note: This data only includes buildings whose emissions are reported
under the
Chicago Energy Benchmarking Ordinance. According to the City “As of 2016,
this list includes all commercial, institutional, and residential buildings larger than
50,000 square feet.” This dataset is also then filtered to only buildings with
reported emissions > 1,000 metric tons CO2 equivalent.
This data is also from 2020, but when new benchmark data is available, we'll update the site.
| Property Name / address | Primary Property Type |
Greenhouse Gas Intensity (kg CO2 eq./sqft) |
Total Greenhouse Emissions (metric tons CO2 eq.) |
|---|---|---|---|
|
Park Hyatt Chicago
800 N Michigan Ave
| Multifamily Housing | 10.7 kg/sqft
Highest 26%
| 7,268 tons
Highest 9%
|
|
York Terrace Apts.
2701 S Indiana Ave
| Multifamily Housing | 10.7 kg/sqft
Highest 26%
| 2,498 tons
Highest 39%
|
|
National Teachers Academy -CPS
55 W Cermak Rd
| K-12 School | 10.6 kg/sqft
Highest 26%
| 1,654 tons
Lowest 36%
|
|
Chicago HS for Agricultural - CPS
3807 W 111th St
| K-12 School | 10.6 kg/sqft
Highest 26%
| 2,043 tons
Lowest 50%
|
|
437 W DIVISION ST
437 W DIVISION ST
| Multifamily Housing | 10.6 kg/sqft
Highest 26%
| 1,162 tons
Lowest 12%
|
|
Horizon Realty Group
5650 N SHERIDAN RD
| Multifamily Housing | 10.6 kg/sqft
Highest 26%
| 1,340 tons
Lowest 21%
|
|
Parkway Gardens
🚩
6415 S Calumet Ave
| Multifamily Housing | 10.6 kg/sqft
Highest 26%
| 9,961 tons
Highest 6%
|
|
Marillac St. Vincent Family Services
212 S Francisco Ave
| Pre-school/Daycare | 10.5 kg/sqft
Highest 26%
| 1,097 tons
Lowest 7%
|
|
1040 W GRANVILLE AVE
1040 W GRANVILLE AVE
| Multifamily Housing | 10.5 kg/sqft
Highest 26%
| 1,467 tons
Lowest 28%
|
|
Columbus Plaza
233 E Wacker Dr
| Multifamily Housing | 10.5 kg/sqft
Highest 26%
| 4,662 tons
Highest 18%
|
|
Brooks Homes
1324 S Loomis St
| Multifamily Housing | 10.5 kg/sqft
Highest 26%
| 2,947 tons
Highest 32%
|
|
Clemente Community Academy HS -CPS
1147 N Western Ave
| K-12 School | 10.4 kg/sqft
Highest 27%
| 3,679 tons
Highest 24%
|
|
2630 N NARRAGANSETT AVE
2630 N NARRAGANSETT AVE
| Retail Store | 10.4 kg/sqft
Highest 27%
| 1,217 tons
Lowest 15%
|
|
CDM Center
243 S Wabash Ave
| College/University | 10.4 kg/sqft
Highest 27%
| 1,912 tons
Lowest 45%
|
|
30 N Michigan Ave
30 N Michigan Ave
| Office | 10.4 kg/sqft
Highest 27%
| 2,307 tons
Highest 43%
|
Data Source:
Chicago Energy Benchmarking Data