Electrify Chicago
According to the
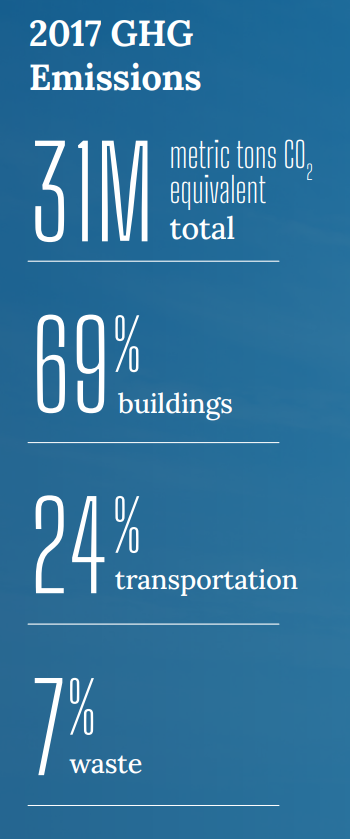
2022 Chicago Climate Action Plan ,
a whopping 69% of Chicago's emissions come from buildings, making it
our biggest challenge and our biggest opportunity as a city to tackle
change. At Electrify Chicago we want to showcase some of the best and worst performing
buildings in the city using publicly available data and manual annotations to add
building photographs and label multi-building owners like universities.
,
a whopping 69% of Chicago's emissions come from buildings, making it
our biggest challenge and our biggest opportunity as a city to tackle
change. At Electrify Chicago we want to showcase some of the best and worst performing
buildings in the city using publicly available data and manual annotations to add
building photographs and label multi-building owners like universities.
You can start by looking at Chicago's buildings with the highest greenhouse gas intensity - this means that they use the most energy when adjusted per unit of square foot, so big buildings could actually perform much better than very inefficient small buildings on this metric.
Chicago Buildings by Greenhouse Gas Intensity
Note: Data only includes large Chicago buildings from 2020
Note: This data only includes buildings whose emissions are reported
under the
Chicago Energy Benchmarking Ordinance. According to the City “As of 2016,
this list includes all commercial, institutional, and residential buildings larger than
50,000 square feet.” This dataset is also then filtered to only buildings with
reported emissions > 1,000 metric tons CO2 equivalent.
This data is also from 2020, but when new benchmark data is available, we'll update the site.
| Property Name / address | Primary Property Type |
Greenhouse Gas Intensity (kg CO2 eq./sqft) |
Total Greenhouse Emissions (metric tons CO2 eq.) |
|---|---|---|---|
|
Juvenile Temporary Detention Center
1100 S Hamilton Ave
| Mixed Use Property | 9.5 kg/sqft
Highest 33%
| 9,742 tons
Highest 6%
|
|
Thorndale Beach South Condominium Association
5855 N Sheridan Rd
| Multifamily Housing | 9.4 kg/sqft
Highest 33%
| 2,706 tons
Highest 35%
|
|
640 N LaSalle Dr
640 N LaSalle St
| Office | 9.4 kg/sqft
Highest 33%
| 2,648 tons
Highest 35%
|
|
Gentile Arena
🏆
6511 N Sheridan Rd
| College/University | 9.4 kg/sqft
Highest 33%
| 1,004 tons
#2 Lowest in Chicago*
|
|
353 N Clark St
🚩
353 N Clark St
| Office | 9.4 kg/sqft
Highest 33%
| 12,769 tons
Highest 4%
|
|
Mckay, Francis M -CPS
6929 S Fairfield
| K-12 School | 9.4 kg/sqft
Highest 33%
| 1,203 tons
Lowest 15%
|
|
Englewood Academy HS -CPS
6201 S Stewart Ave
| K-12 School | 9.4 kg/sqft
Highest 33%
| 1,778 tons
Lowest 41%
|
|
840 Lake Shore Condominium Association
840 N Lake Shore Dr
| Multifamily Housing | 9.4 kg/sqft
Highest 33%
| 2,613 tons
Highest 36%
|
|
7033 N KEDZIE AVE
7033 N KEDZIE AVE
| Multifamily Housing | 9.4 kg/sqft
Highest 33%
| 3,042 tons
Highest 30%
|
|
Altgeld Gardens
🚩
925 E 130th St
| Multifamily Housing | 9.4 kg/sqft
Highest 33%
| 11,064 tons
Highest 5%
|
|
55 E Monroe
🚩
55 E Monroe St
| Office | 9.3 kg/sqft
Highest 34%
| 15,558 tons #37 Highest
|
|
550 W Jackson
550 W Jackson Blvd
| Office | 9.3 kg/sqft
Highest 34%
| 4,098 tons
Highest 20%
|
|
The Buckingham Condominium Association
360 E Randolph St
| Multifamily Housing | 9.3 kg/sqft
Highest 34%
| 4,720 tons
Highest 17%
|
|
Ellington Elementary -CPS
243 N Parkside Ave
| K-12 School | 9.3 kg/sqft
Highest 34%
| 1,044 tons
Lowest 4%
|
|
Grand Blvd Plaza
5401 S WENTWORTH AVE
| Strip Mall | 9.3 kg/sqft
Highest 34%
| 1,287 tons
Lowest 19%
|
Data Source:
Chicago Energy Benchmarking Data