Electrify Chicago
According to the
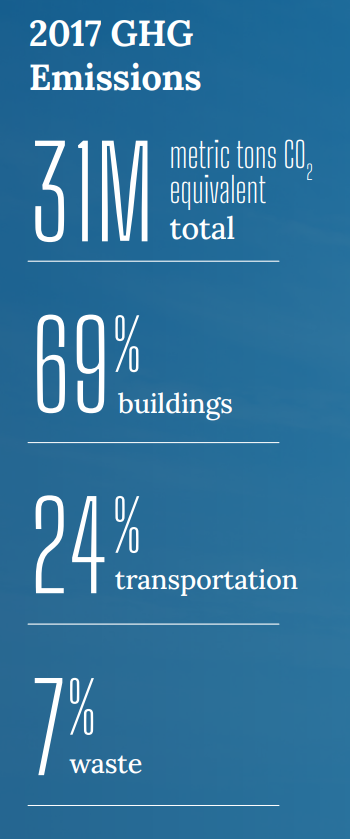
2022 Chicago Climate Action Plan ,
a whopping 69% of Chicago's emissions come from buildings, making it
our biggest challenge and our biggest opportunity as a city to tackle
change. At Electrify Chicago we want to showcase some of the best and worst performing
buildings in the city using publicly available data and manual annotations to add
building photographs and label multi-building owners like universities.
,
a whopping 69% of Chicago's emissions come from buildings, making it
our biggest challenge and our biggest opportunity as a city to tackle
change. At Electrify Chicago we want to showcase some of the best and worst performing
buildings in the city using publicly available data and manual annotations to add
building photographs and label multi-building owners like universities.
You can start by looking at Chicago's buildings with the highest greenhouse gas intensity - this means that they use the most energy when adjusted per unit of square foot, so big buildings could actually perform much better than very inefficient small buildings on this metric.
Chicago Buildings by Greenhouse Gas Intensity
Note: Data only includes large Chicago buildings from 2020
Note: This data only includes buildings whose emissions are reported
under the
Chicago Energy Benchmarking Ordinance. According to the City “As of 2016,
this list includes all commercial, institutional, and residential buildings larger than
50,000 square feet.” This dataset is also then filtered to only buildings with
reported emissions > 1,000 metric tons CO2 equivalent.
This data is also from 2020, but when new benchmark data is available, we'll update the site.
| Property Name / address | Primary Property Type |
Greenhouse Gas Intensity (kg CO2 eq./sqft) |
Total Greenhouse Emissions (metric tons CO2 eq.) |
|---|---|---|---|
|
Metropolitan Pier and Exposition Authority
🚨
📷
301 Cermak Rd
| Convention Center | 8.3 kg/sqft
Highest 42%
| 76,935 tons #4 Highest
|
|
111 S Wacker
111 S Wacker
| Office | 8.2 kg/sqft
Highest 43%
| 10,270 tons
Highest 6%
|
|
20 S Clark
20 S Clark St
| Office | 8.2 kg/sqft
Highest 43%
| 3,830 tons
Highest 23%
|
|
203 N LaSalle St
203 N LaSalle St
| Office | 8.2 kg/sqft
Highest 43%
| 5,430 tons
Highest 14%
|
|
Two North Riverside Plaza
2 N Riverside Plz
| Office | 8.2 kg/sqft
Highest 43%
| 6,050 tons
Highest 12%
|
|
Former Coyne College
330 N Green St
| Office | 8.2 kg/sqft
Highest 43%
| 4,581 tons
Highest 18%
|
|
Uplift Community HS -CPS
900 W Wilson Ave
| K-12 School | 8.2 kg/sqft
Highest 43%
| 1,227 tons
Lowest 16%
|
|
Target, Chicago McKinley Park (2078)
1940 W 33rd St
| Retail Store | 8.2 kg/sqft
Highest 43%
| 1,138 tons
Lowest 10%
|
|
Corliss HS -CPS
821 E 103rd St
| K-12 School | 8.2 kg/sqft
Highest 43%
| 2,237 tons
Highest 45%
|
|
1240 N LAKE SHORE DR
1240 N LAKE SHORE DR
| Multifamily Housing | 8.2 kg/sqft
Highest 43%
| 1,241 tons
Lowest 17%
|
|
Fletcher Jones Audi
949 N ELSTON AVE
| Automobile Dealership | 8.2 kg/sqft
Highest 43%
| 1,983 tons
Lowest 48%
|
|
740 W FULTON ST
740 W FULTON ST
| Multifamily Housing | 8.2 kg/sqft
Highest 43%
| 1,355 tons
Lowest 22%
|
|
Sixty Forty North Wells
640 N Wells
| Multifamily Housing | 8.2 kg/sqft
Highest 43%
| 1,766 tons
Lowest 41%
|
|
340 on the Park
340 E Randolph St
| Multifamily Housing | 8.2 kg/sqft
Highest 43%
| 6,544 tons
Highest 11%
|
|
The Townhouse Apartments
7022 S SOUTH SHORE DR
| Multifamily Housing | 8.2 kg/sqft
Highest 43%
| 1,065 tons
Lowest 5%
|
Data Source:
Chicago Energy Benchmarking Data