Electrify Chicago
According to the
2022 Chicago Climate Action Plan ,
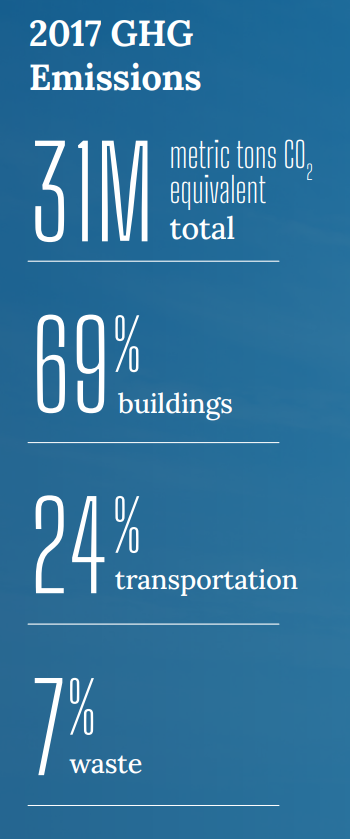
a whopping 69% of Chicago's emissions come from buildings, making it
our biggest challenge and our biggest opportunity as a city to tackle
change. At Electrify Chicago we want to showcase some of the best and worst performing
buildings in the city using publicly available data and manual annotations to add
building photographs and label multi-building owners like universities.
,
a whopping 69% of Chicago's emissions come from buildings, making it
our biggest challenge and our biggest opportunity as a city to tackle
change. At Electrify Chicago we want to showcase some of the best and worst performing
buildings in the city using publicly available data and manual annotations to add
building photographs and label multi-building owners like universities.
You can start by looking at Chicago's buildings with the highest greenhouse gas intensity - this means that they use the most energy when adjusted per unit of square foot, so big buildings could actually perform much better than very inefficient small buildings on this metric.
Chicago Buildings by Greenhouse Gas Intensity
Note: Data only includes large Chicago buildings from 2020
Note: This data only includes buildings whose emissions are reported
under the
Chicago Energy Benchmarking Ordinance. According to the City “As of 2016,
this list includes all commercial, institutional, and residential buildings larger than
50,000 square feet.” This dataset is also then filtered to only buildings with
reported emissions > 1,000 metric tons CO2 equivalent.
This data is also from 2020, but when new benchmark data is available, we'll update the site.
| Property Name / address | Primary Property Type |
Greenhouse Gas Intensity (kg CO2 eq./sqft) |
Total Greenhouse Emissions (metric tons CO2 eq.) |
|---|---|---|---|
|
The Parker Fulton Market
730 W COUCH PL
| Multifamily Housing | 7.0 kg/sqft
Lowest 38%
| 1,770 tons
Lowest 41%
|
|
321 339 S DESPLAINES ST
321 339 S DESPLAINES ST
| Multifamily Housing | 7.0 kg/sqft
Lowest 38%
| 1,254 tons
Lowest 17%
|
|
407 415 S DEARBORN ST
407 415 S DEARBORN ST
| Multifamily Housing | 7.0 kg/sqft
Lowest 38%
| 1,401 tons
Lowest 24%
|
|
MacLean Center
112 S Michigan Ave
| College/University | 7.0 kg/sqft
Lowest 38%
| 1,653 tons
Lowest 36%
|
|
The Boyce Building
500 - 510 N Dearborn St
| Office | 7.0 kg/sqft
Lowest 38%
| 1,046 tons
Lowest 4%
|
|
Old Republic Building
301 - 317 N Michigan Ave
| Office | 7.0 kg/sqft
Lowest 38%
| 1,545 tons
Lowest 32%
|
|
Wilson Yard
1026 - 1032 W Montrose Ave
| Mixed Use Property | 7.0 kg/sqft
Lowest 38%
| 2,897 tons
Highest 32%
|
|
Carver Millitary Academy -CPS
13100 S Carver Dr
| K-12 School | 7.0 kg/sqft
Lowest 38%
| 2,086 tons
Highest 49%
|
|
Burnham Park Plaza Condo
40 E 9th St
| Multifamily Housing | 7.0 kg/sqft
Lowest 38%
| 2,916 tons
Highest 32%
|
|
222 E PEARSON ST
222 E PEARSON ST
| Multifamily Housing | 7.0 kg/sqft
Lowest 38%
| 1,554 tons
Lowest 32%
|
|
Prairie District Homes Tower Residences Condominiu
1717 S Prairie Ave
| Multifamily Housing | 7.0 kg/sqft
Lowest 38%
| 2,043 tons
Lowest 50%
|
|
3130 N Lake Shore Dr
3130 N Lake Shore Dr
| Multifamily Housing | 7.0 kg/sqft
Lowest 38%
| 1,656 tons
Lowest 36%
|
|
Lakeview East Cooperative
707 W Waveland Ave
| Multifamily Housing | 7.0 kg/sqft
Lowest 38%
| 1,649 tons
Lowest 35%
|
|
5757 N Sheridan CA
🏆
5757 N Sheridan Rd
| Multifamily Housing | 7.0 kg/sqft
Lowest 38%
| 1,384 tons
Lowest 24%
|
|
7447 South Shore, LLC - South Shore Beach Apartments
7447 S South Shore Dr
| Multifamily Housing | 7.0 kg/sqft
Lowest 38%
| 2,361 tons
Highest 42%
|
Data Source:
Chicago Energy Benchmarking Data