Electrify Chicago
According to the
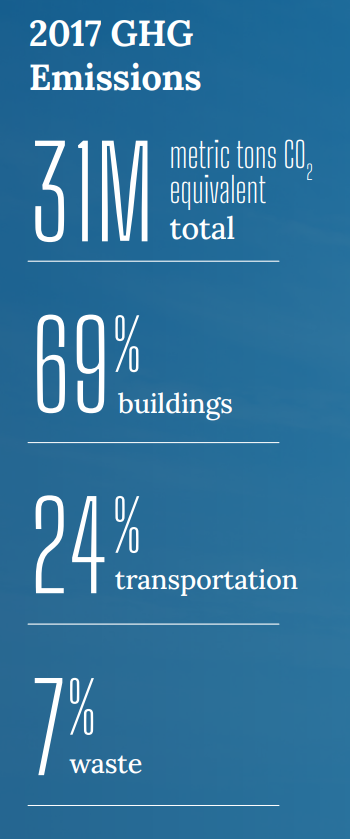
2022 Chicago Climate Action Plan ,
a whopping 69% of Chicago's emissions come from buildings, making it
our biggest challenge and our biggest opportunity as a city to tackle
change. At Electrify Chicago we want to showcase some of the best and worst performing
buildings in the city using publicly available data and manual annotations to add
building photographs and label multi-building owners like universities.
,
a whopping 69% of Chicago's emissions come from buildings, making it
our biggest challenge and our biggest opportunity as a city to tackle
change. At Electrify Chicago we want to showcase some of the best and worst performing
buildings in the city using publicly available data and manual annotations to add
building photographs and label multi-building owners like universities.
You can start by looking at Chicago's buildings with the highest greenhouse gas intensity - this means that they use the most energy when adjusted per unit of square foot, so big buildings could actually perform much better than very inefficient small buildings on this metric.
Chicago Buildings by Greenhouse Gas Intensity
Note: Data only includes large Chicago buildings from 2020
Note: This data only includes buildings whose emissions are reported
under the
Chicago Energy Benchmarking Ordinance. According to the City “As of 2016,
this list includes all commercial, institutional, and residential buildings larger than
50,000 square feet.” This dataset is also then filtered to only buildings with
reported emissions > 1,000 metric tons CO2 equivalent.
This data is also from 2020, but when new benchmark data is available, we'll update the site.
| Property Name / address | Primary Property Type |
Greenhouse Gas Intensity (kg CO2 eq./sqft) |
Total Greenhouse Emissions (metric tons CO2 eq.) |
|---|---|---|---|
|
SoNo East
840 W Blackhawk St
| Multifamily Housing | 5.2 kg/sqft
Lowest 10%
| 1,666 tons
Lowest 36%
|
|
Chestnut Tower
121 W Chestnut St
| Multifamily Housing | 5.2 kg/sqft
Lowest 10%
| 1,222 tons
Lowest 16%
|
|
Hirsch Metropolitan HS -CPS
7740 S Ingleside Ave
| K-12 School | 5.2 kg/sqft
Lowest 10%
| 1,134 tons
Lowest 10%
|
|
St. Rita of Cascia HS
7740 S Western Ave
| K-12 School | 5.2 kg/sqft
Lowest 10%
| 1,420 tons
Lowest 25%
|
|
Lake View HS -CPS
4015 N Ashland Ave
| K-12 School | 5.2 kg/sqft
Lowest 10%
| 1,376 tons
Lowest 23%
|
|
120 S Riverside Plaza
120 S Riverside Plz
| Office | 5.2 kg/sqft
Lowest 10%
| 4,075 tons
Highest 21%
|
|
3900 Lake Shore Drive Condominium Association
3900 N Lake Shore Dr
| Multifamily Housing | 5.2 kg/sqft
Lowest 10%
| 1,355 tons
Lowest 22%
|
|
Kennelly Square Condominium Association
1749 N Wells St
| Multifamily Housing | 5.2 kg/sqft
Lowest 10%
| 1,685 tons
Lowest 37%
|
|
1700 East 56th Street
1700 E 56th St
| Multifamily Housing | 5.2 kg/sqft
Lowest 10%
| 2,489 tons
Highest 39%
|
|
ParkView at River East Condominium Association
505 N McClurg Ct
| Multifamily Housing | 5.2 kg/sqft
Lowest 10%
| 3,421 tons
Highest 26%
|
|
One Bennet Park Apartments
451 E Grand Ave
| Multifamily Housing | 5.2 kg/sqft
Lowest 10%
| 4,058 tons
Highest 21%
|
|
Tiara Homeowners Association
6145 6147 N SHERIDAN RD
| Multifamily Housing | 5.1 kg/sqft
Lowest 9%
| 1,094 tons
Lowest 7%
|
|
The Gwen
521 N Rush St
| Hotel | 5.1 kg/sqft
Lowest 9%
| 1,820 tons
Lowest 43%
|
|
Transportation Building Condominium Association
600 S Dearborn St
| Multifamily Housing | 5.1 kg/sqft
Lowest 9%
| 2,265 tons
Highest 44%
|
|
311 W Illinois St
311 W Illinois St
| Multifamily Housing | 5.1 kg/sqft
Lowest 9%
| 1,493 tons
Lowest 29%
|
Data Source:
Chicago Energy Benchmarking Data